Cordax Tutorial
In this page, users can find instructions on how to use Cordax.
Registered / Non-registered users
This platform is compatible with all devices and web browsers. While email registration is optional for users, it provides registered users the ability to maintain a personalized dashboard, enabling them to monitor the status of submitted tasks and access the outcomes of previous executions.
Cordax Input page
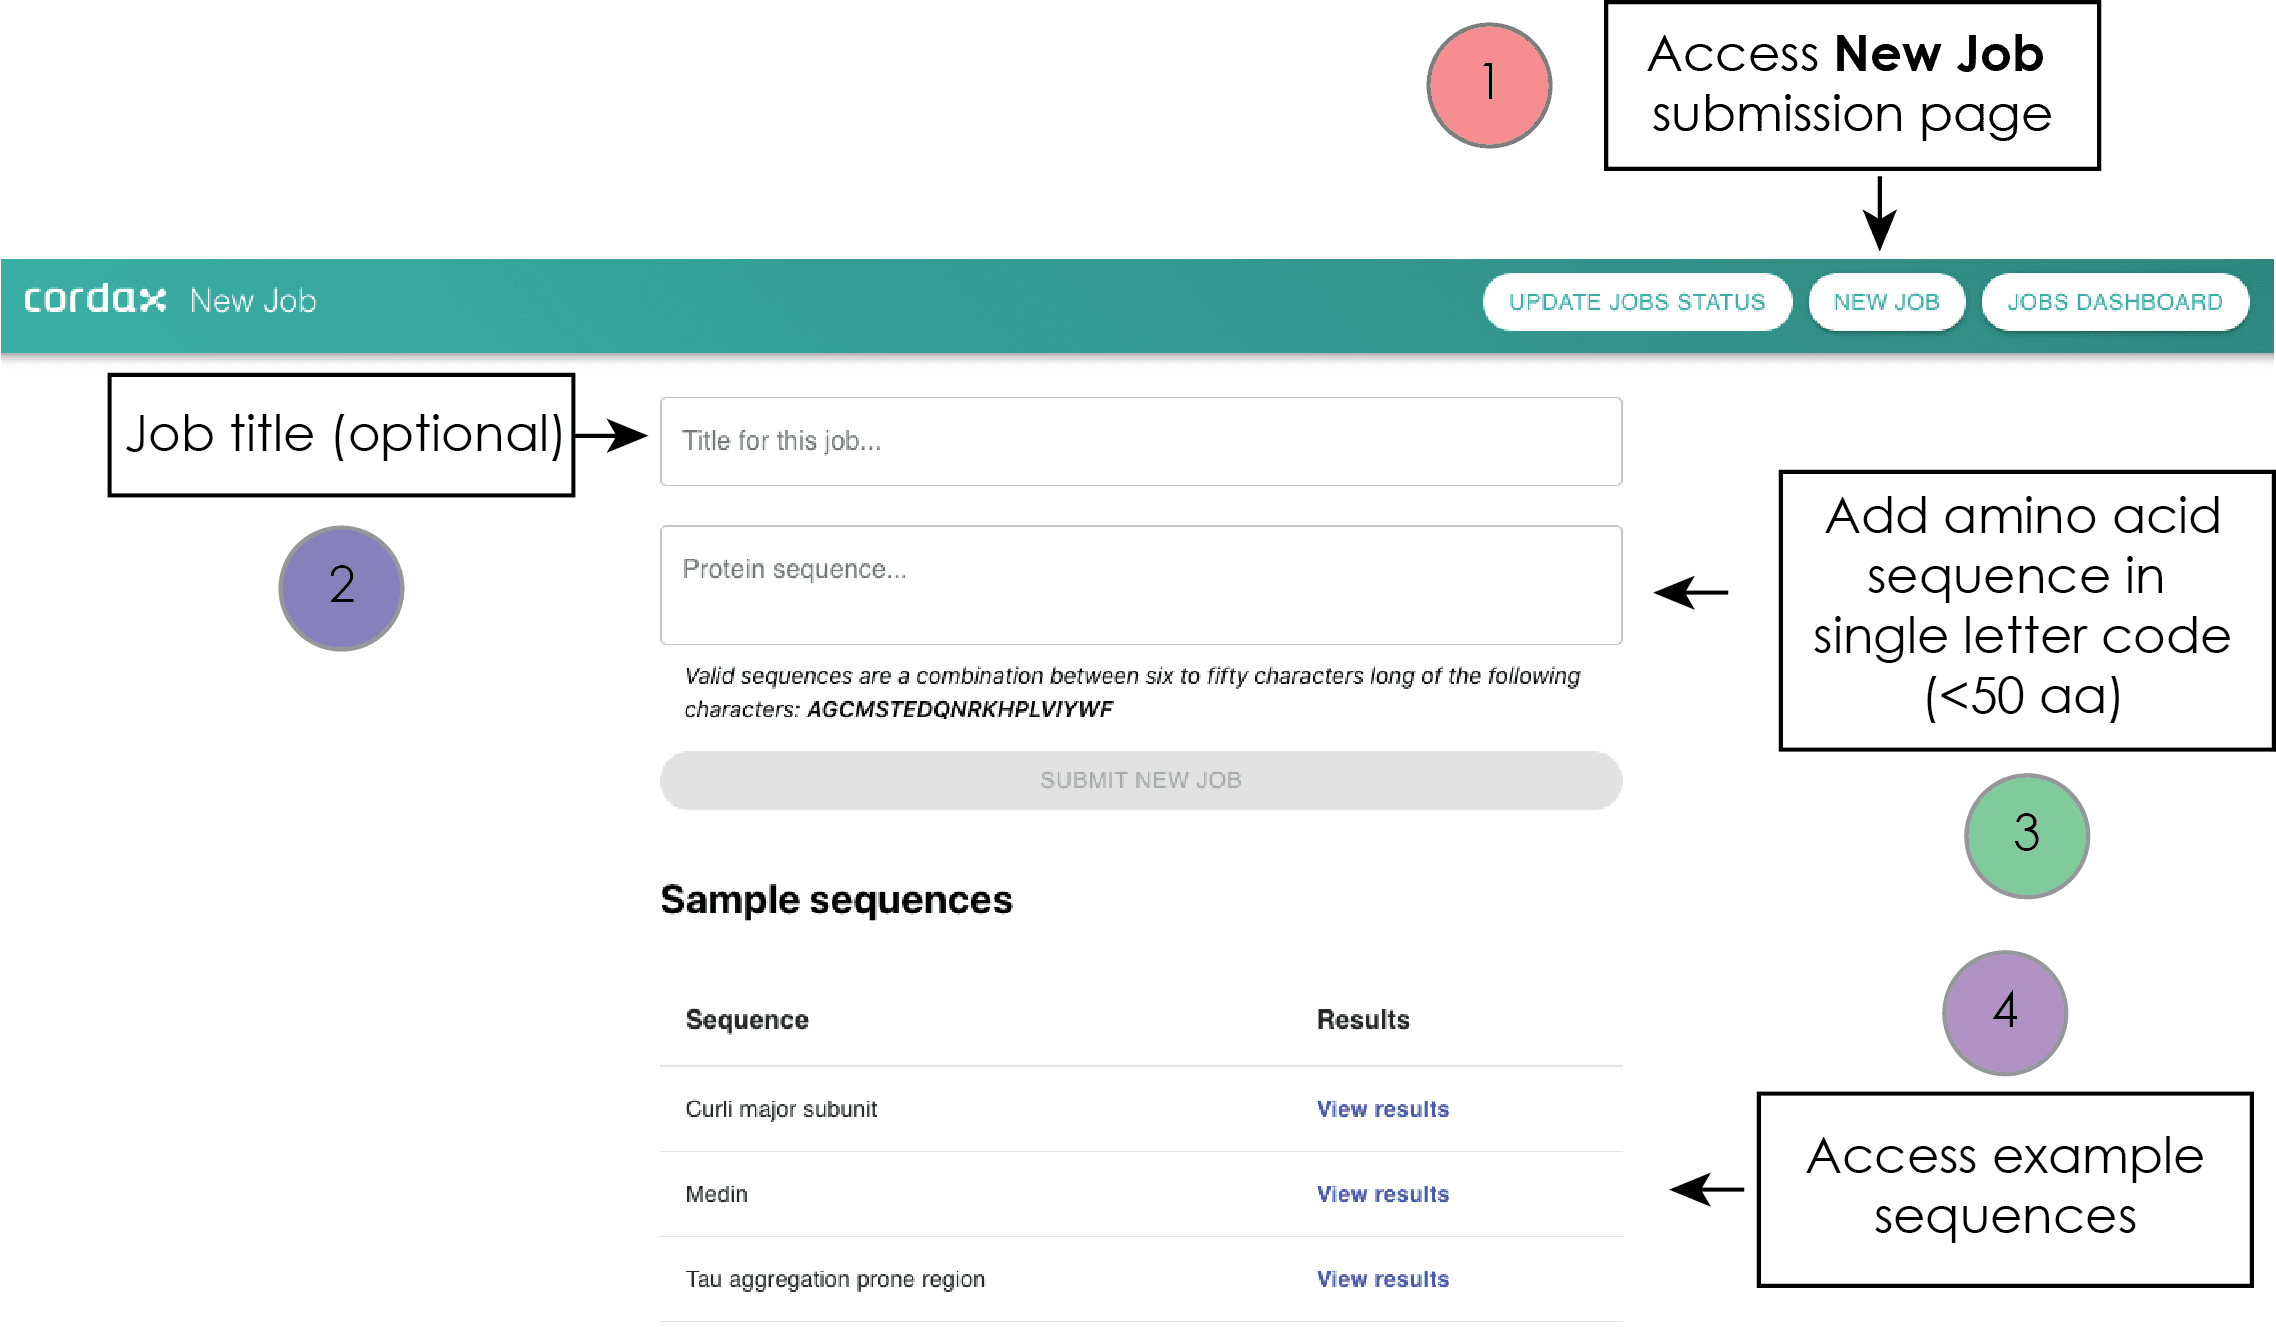
The new job submission page, as well as the personalized dashboard, are both accessible through dedicated buttons that are permanently displayed on the web server title bar:
__
Results page
Sequence query / Structural representation
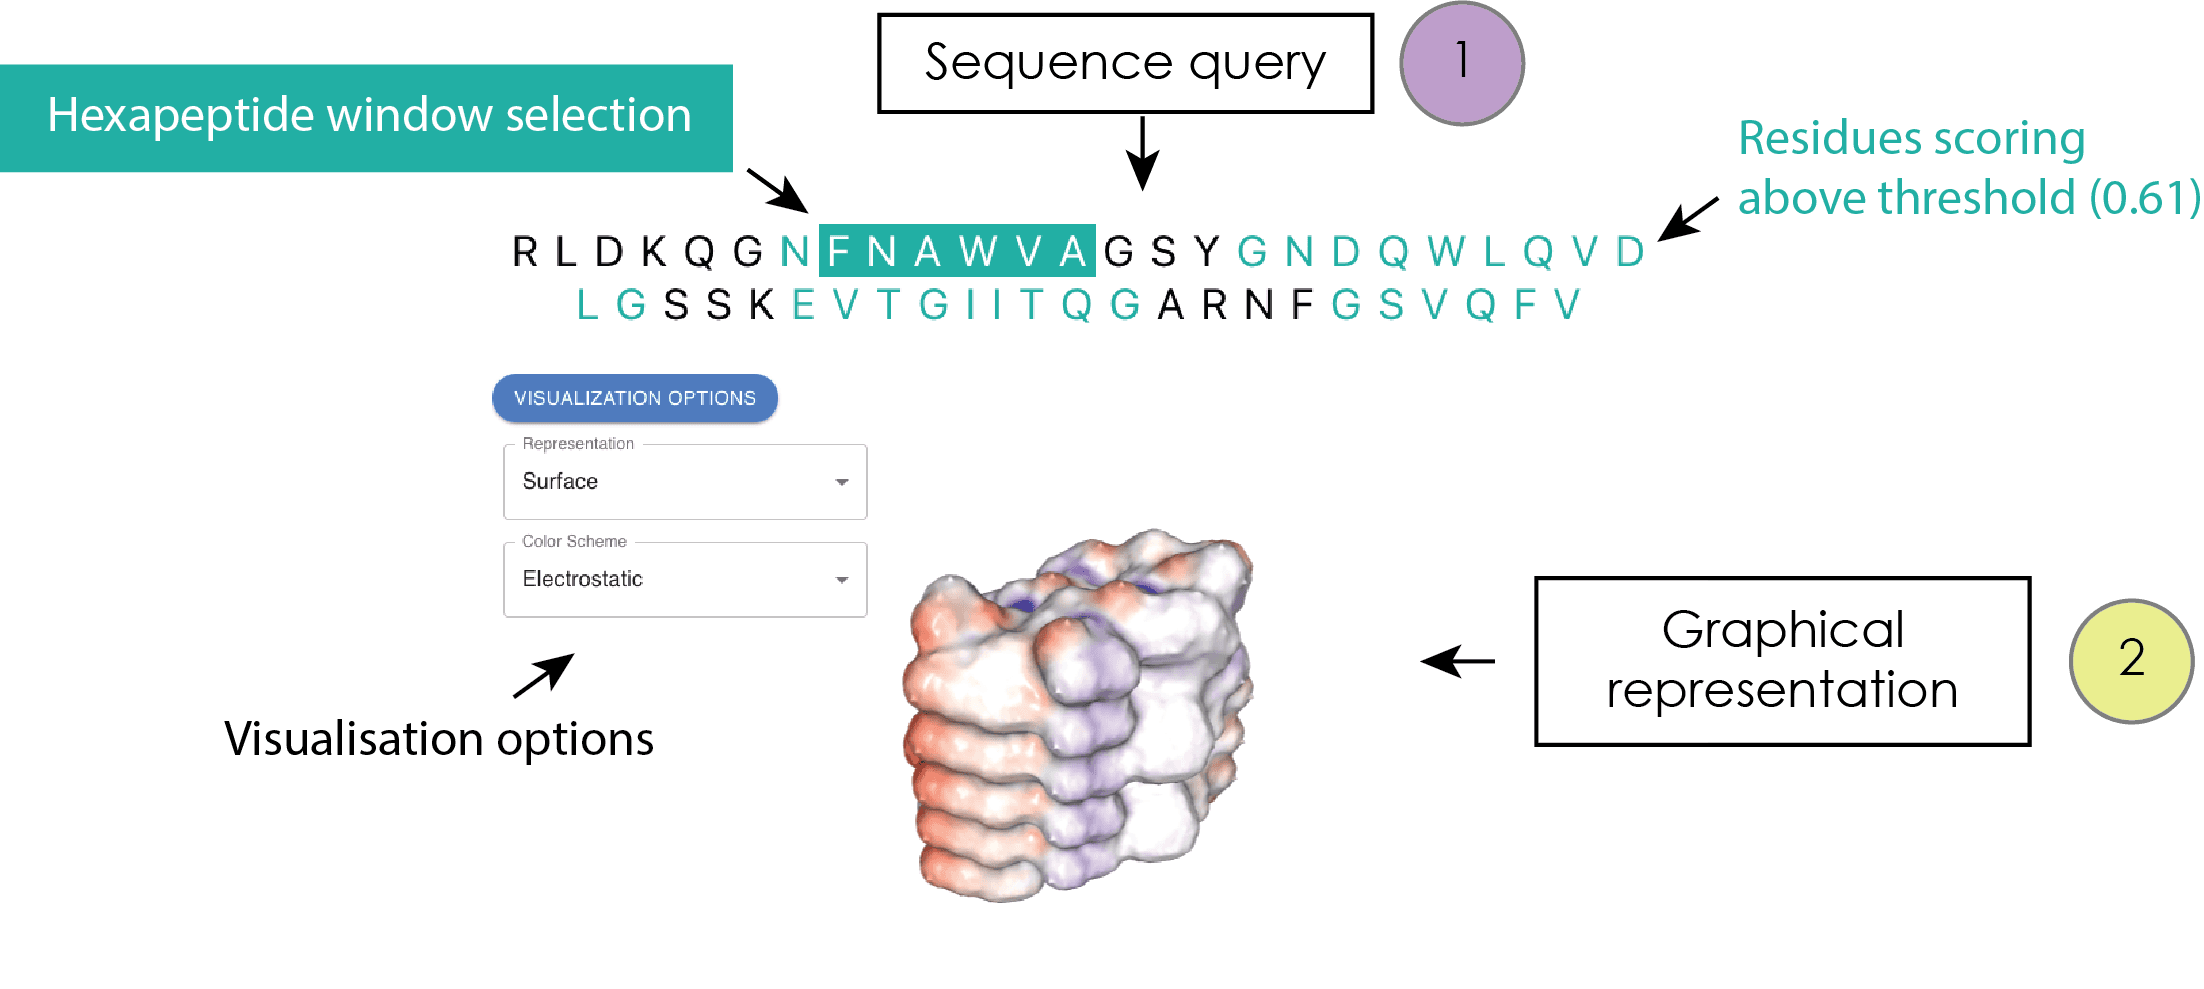
Once accessed, a result page displays the query sequence on the top, with residues scoring higher than the Cordax threshold (0.61) (Louros N., et al., Nat Commun 11:3314, 2020).
The sequence presented at the top of the output page is interactive, whereby individual predicted residues can be engaged by a user. This interaction serves to illuminate the protein sequence segments that score above the threshold. Clicking on predicted residues highlights the hexapeptide window of prediction starting with this residue in position 1. If this window is scored above the threshold of prediction, this selection concurrently activates a graphical plugin interface situated beneath the query sequence. Within this graphical interface, various modes for representing the structural topology of selected hexapeptides that surpass the Cordax aggregation propensity threshold are supported. These modes encompass options such as cartoon, ball and stick, ribbon, space-fill models, and surface representations, among others. Furthermore, a range of distinctive color themes are provided predicated on diverse properties, including chain ID, atom and residue types, hydrophobicity, and more.
Plotter
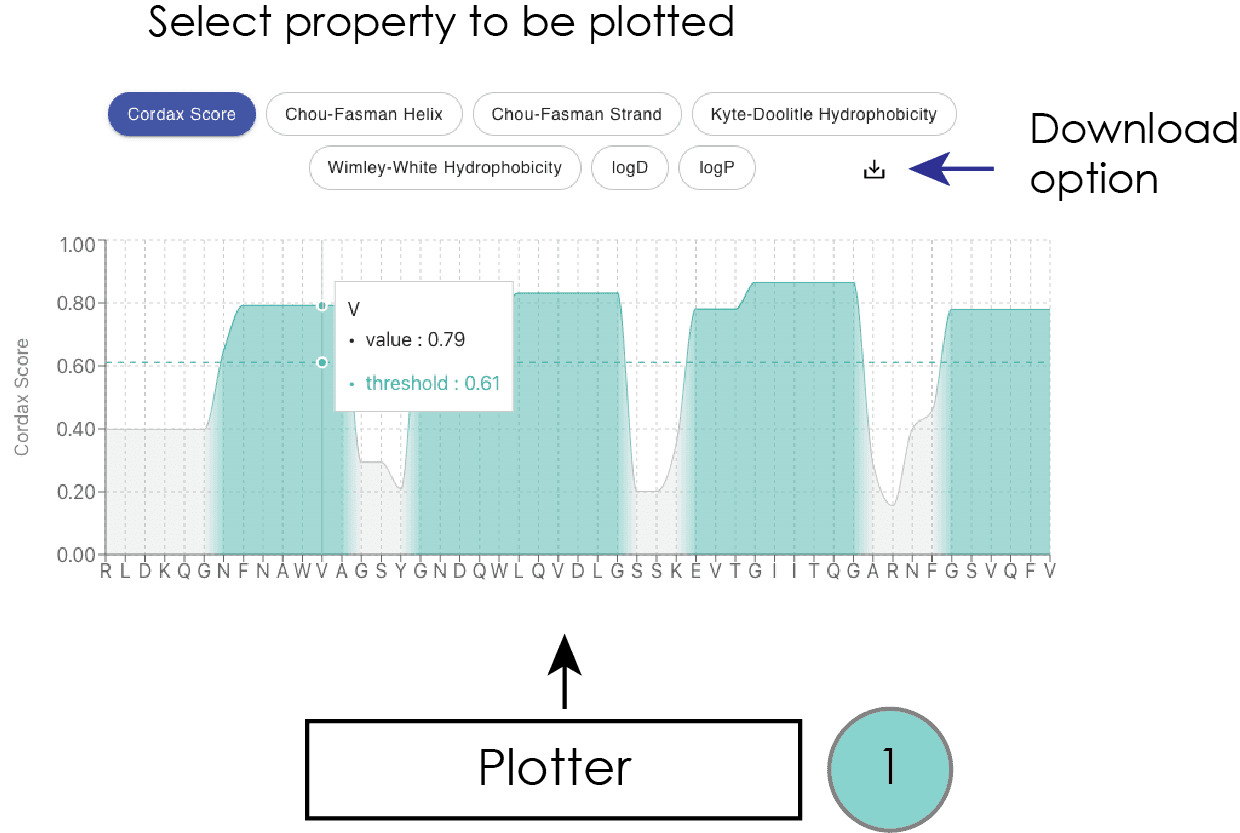
A graphical representation of the results shown at the bottom of the output page better illustrates this. Specifically, this interactive plot contains the amino acid query sequence on the x-axis, while alternative options are available to the user for display on the y-axis. Starting with the Cordax scoring as the default representation, by hovering over the query sequence a box appears labeling both individual residues, their corresponding Cordax aggregation scores, and the defined threshold of prediction. The latter is also shown with a dashed green light. The same interactive features are available for additional sequence properties that can be selected by the user and displayed on the interactive plot. For secondary structure propensity, we used the Chou-Fasman empirical technique (Chou and Fasman, 1974). Sequence hydrophobicity is calculated based on two different scales, namely the Kyte-Doolittle (Kyte and Doolittle, 1982) and the Wimley-White scale which holds considerable importance as it considers the combined contributions of both the peptide bonds and the sidechains in absolute values, providing a direct and empirical foundation based on experimentally determined values for the transfer free energies of polypeptides (Wimley and White, 1996). Finally, considering the ability of Cordax to predict with high accuracy aggregation-prone sequence segments of higher solubility, we have included per residue calculations of partition coefficients calculated using PlogP, a method that calculates peptide coefficients by a residue-addition method and also considers blocked termini, as well as partition as a function of the pH (ionizable and non-ionizable) (Tao, et al., 1999).
Comparison to experimentally determined APRs
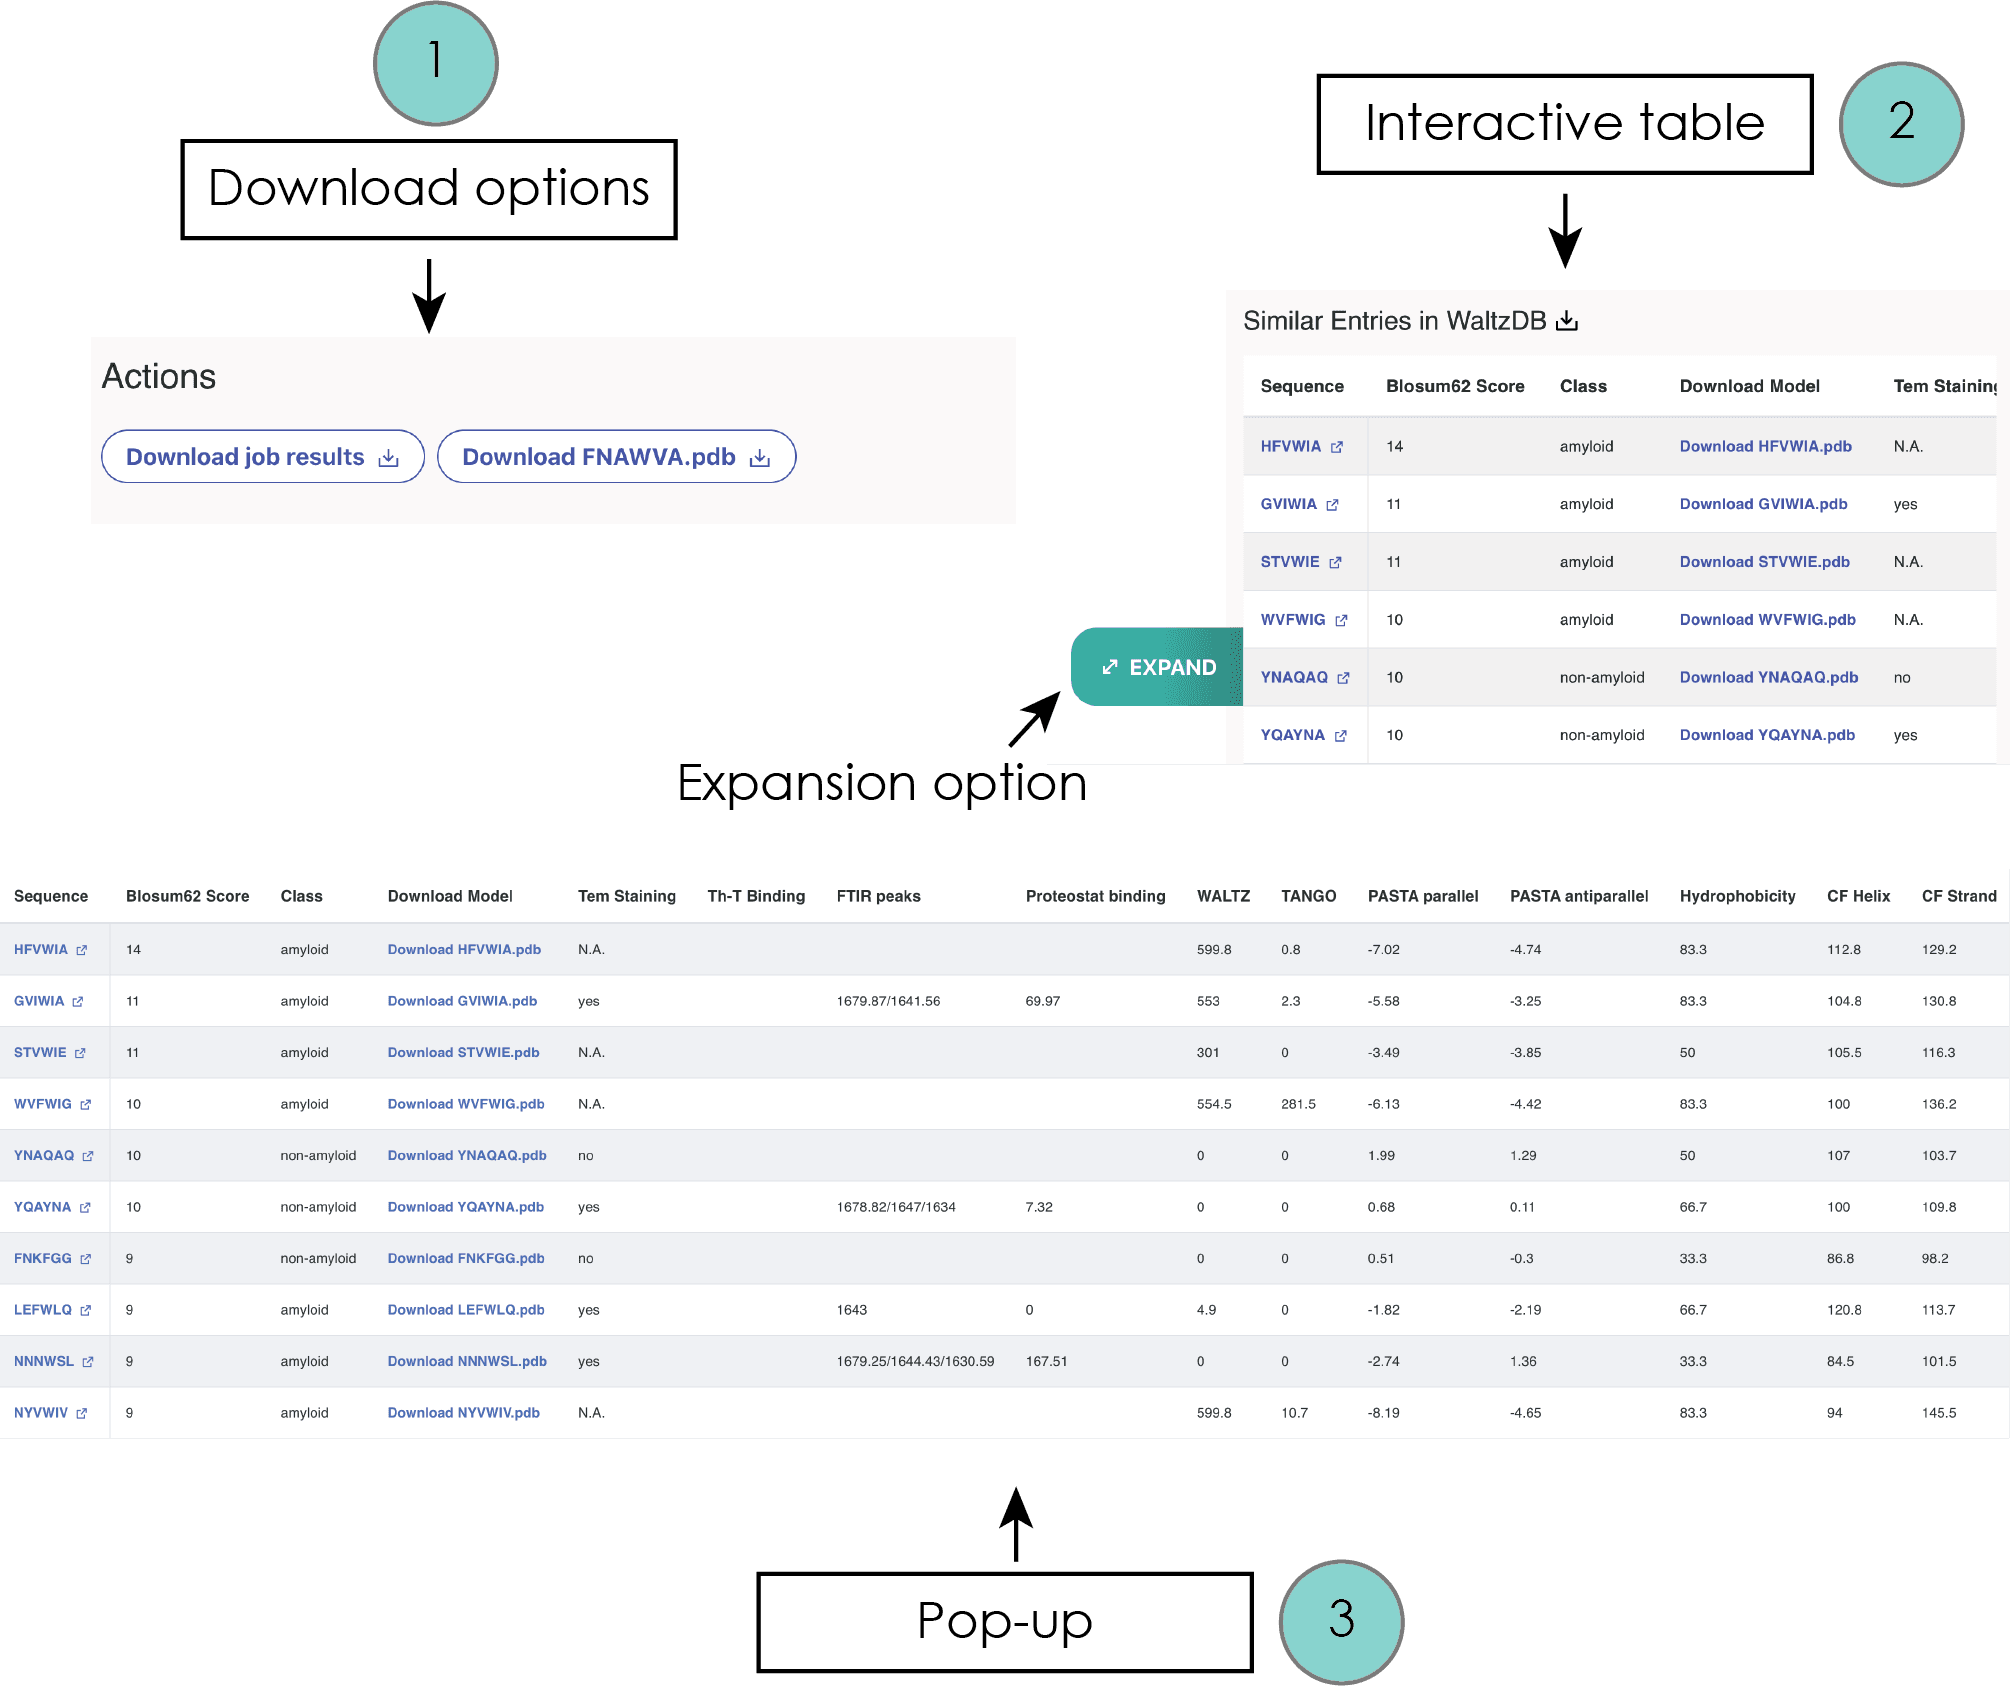
For each identified aggregation-prone hexapeptide region selected from the displayed query sequence, an adjacent right panel becomes active, offering several supplementary features. Primarily, users are provided with the option to download specific content at the top of this panel. This includes the Cordax scoring files in the .csv file format and the predicted structural topology in Protein Data Bank file format (.pdb files) for windows scoring above the threshold.
Upon selecting a hexapeptide, an interactive table is displayed on the right panel. This table, which can be expanded for improved visualization by moving the cursor over the table and selecting an expansion button option appearing on the left, enumerates peptide sequences that correspond to entries within WALTZ-DB 2.0, currently the largest openly accessible repository of peptides with experimentally ascertained amyloidogenic properties (Louros N., et al., Nucleic Acids Res, 48: D389–D393, 2019).
The sequences are organized based on their sequence similarity to the selected predicted hexapeptide, calculated using the Blosum62 matrix. This table further provides valuable data concerning:
- Links to corresponding WALTZ-DB entries
- Download options for topological models
- Experimental validation methods
- Aggregation prediction propensity (Waltz, TANGO, PASTA2)
- Hydrophobicity
- Secondary structure propensity
_
References
When using Cordax, please cite:
- Louros, N., et al. Structure-based machine-guided mapping of amyloid sequence space reveals uncharted sequence clusters with higher solubilities. Nat Commun 11, 3314 (2020).